
RETECHNOLOGY PREMIUM MARKETPLACE RELATED PRODUCTS | WEBINARS | SPECIAL OFFERS


You are viewing our site as an Agent, Switch Your View:
Agent | Broker Reset Filters to Default Back to ListRPR New User Series: Mapping Your Property’s Story
November 19 2015
 It doesn't take long for a REALTOR® to access a map while researching properties on RPR. That's because maps serve such an important role in your quest to tell the property's complete story. From aerial, road, and overhead views, to schools, parcels, estimated values, heat maps, overlays and more, we'll show you how easy it is to draw or designate your map in ways that suit every type of interest or need. And since location is such a key factor in real estate, what better way is there to explore than on a dynamic map?
To begin map searching, first conduct a preliminary search for properties in any geographic area using the Search bar at narrpr.com. Once complete, toggle the results page from List View to Map View in the white tabs above the results. To get to the map view from a property details page, select Bigger Map on the right side of the page.
In this view, which features a large map, define your own search areas by drawing on the map, or by displaying outlines of geographies such as neighborhoods, ZIPs, cities or counties on the map, and then searching one or more of those areas. Drawing on an RPR map is easy. Simply click on the Draw button to trace an outline of the area you'd like to select, draw a circle or polygon, or use your finger to draw a free-form shape. It's that simple. And for those times when you're not feeling like Picasso, rely on these tools to draw and search for you:
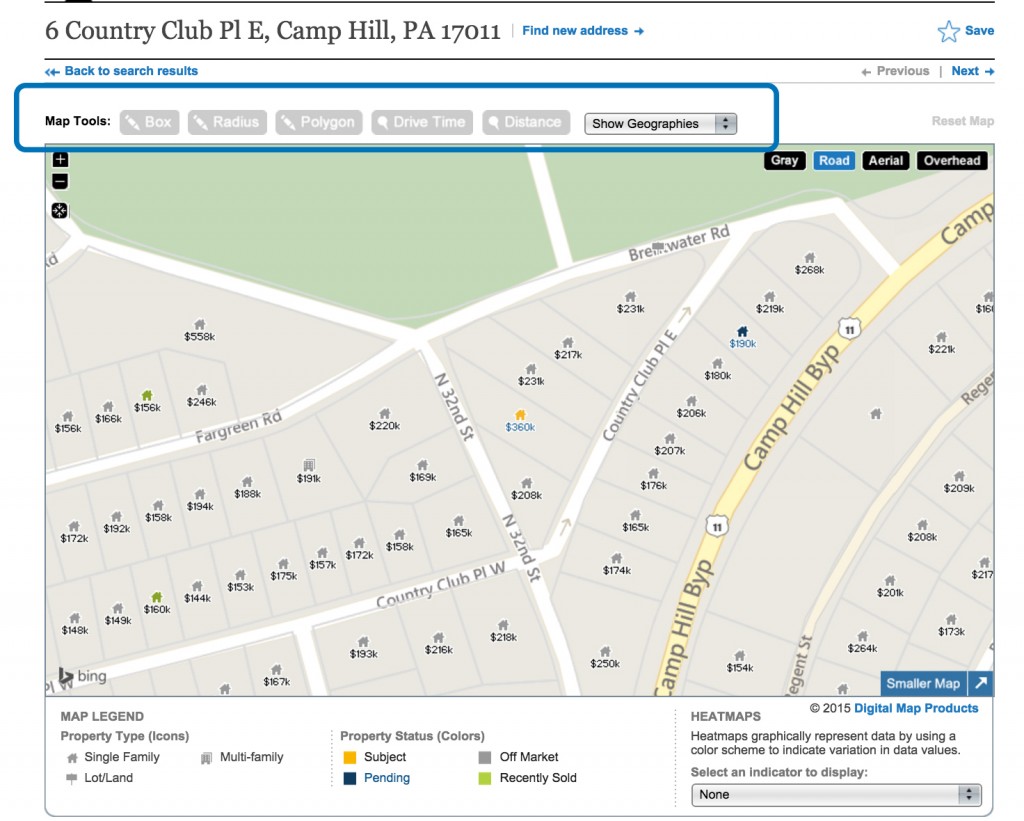
- Box Search - Searching a box (rectangle or square) can be helpful for finding a potentially representative sample of properties in an area you do not know well.
- Radius Search - Like the box search, the radius search is helpful for assembling a sampling of properties, or it can be useful if your search involves a landmark or property within a three-mile expanse of a location.
- Polygon Search - Remember geometry? Brush off those dust bunnies by drawing your own polygon. Your shape can be as simple as a triangle or have many sides. A polygon search can be helpful when you have clear, linear boundaries for the area you want to search, for instance a highway and a river.
- Drive Time - The perfect anecdote for today's busy consumers. The drive time search option, based on traffic patterns, enables the display of approximate driving times in average conditions. The tool is helpful, for instance, if a client is searching for a property no more than 15 minutes from a specific location like an office, school, or other property.
- Distance - Use the Distance search option to measure 3, 5 and 10 miles from a point.
- Geographic Search - Conduct a geographic search by ZIP, neighborhood, city or county by selecting your preferred option from the drop down "Show Geographies." Boundaries of the type of geography you selected, e.g. ZIPs, will be shown on the map and you can click to select them.
Layered Heat Maps
For REALTORS®, layered heat maps unearth current market trends and historical data from up to 11 different datasets—each layer a graphical representation of a geography's home values, average sales price, flood zones, square foot values, distressed properties, and more.
Find the Heat Maps option below the map and to the right. It's helpful to choose the Gray map background option (as opposed to the Aerial, Overhead or Road views) when using heat map layers so you can better visualize the data. Choose an indicator such as Year Built or Flood Zones to see similarities and differences across the area you searched. A legend for interpreting the data is shown below the map.
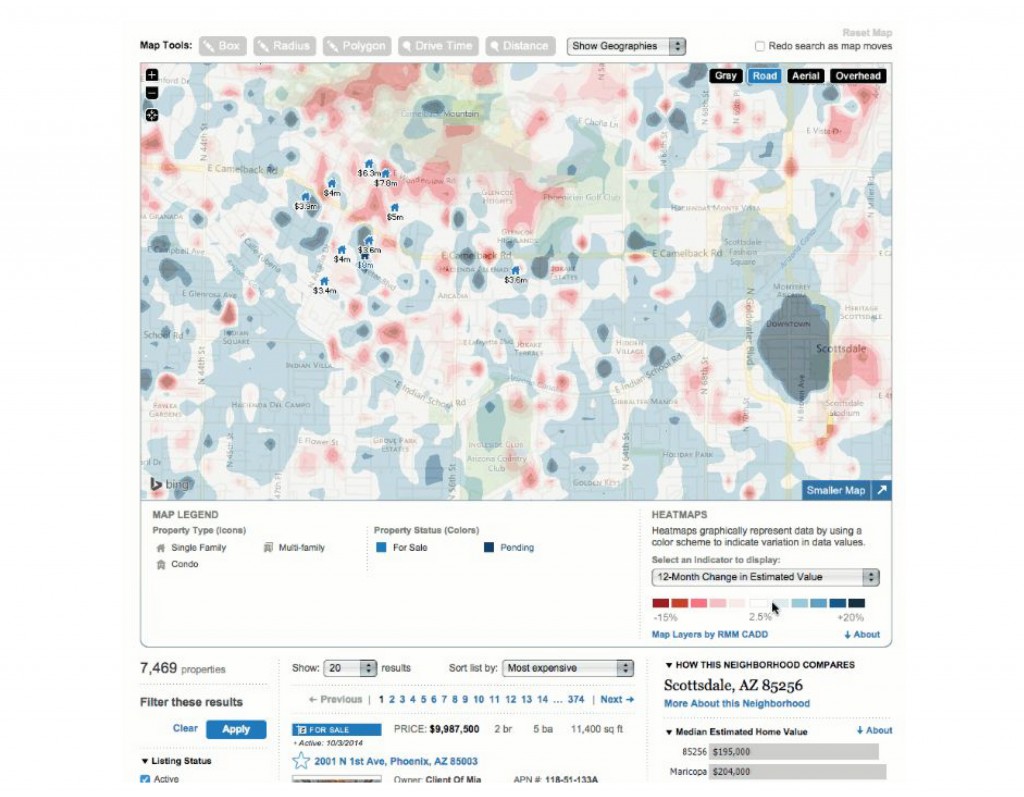
Flood Zones
This map layer shows an area's flood zone designation as determined by the Federal Emergency Management Agency (FEMA). A high-risk area has a 1 percent or greater annual chance of flooding and a 26 percent chance of flooding over the life of a 30-year mortgage. High-risk areas are shaded red or orange on the map. The coast areas, shown in purple, are also considered high risk. The green areas are low to moderate risk. A moderate-risk area is between risk limits of a 100-year and 500-year flood. White areas are undetermined, and all other areas are considered no or low risk.
Time to jump in and experiment with what you've learned about RPR maps.
Four simple steps to map searching using the Box, Polygon and Radius options:
- Choose your preferred map-drawing method from the options listed at the top of the map.
- Each option operates slightly different but is also intuitive, i.e., holding down the mouse to draw your map.
- Release the mouse to allocate the search shape.
- A pop up will offer options to search, save or edit the area.
Four simple steps to map searching using the Drive Time and Distance options:
- Click a location on the map or enter an address in the search bar.
- Choose distance or drive time from the pop-up options.
- Click on your distance/time from the map overlay.
- A pop up will offer options to search, save or edit the area.
Congratulations!
You've completed RPR's "Mapping 101" class. Now it's time to visit narrpr.com and experiment with what you've learned. If you get stuck, our 24/7 Help Desk is here to help.
To view the original article, visit the RPR blog.